Pulsar Reporting UI
Pulsar is an open-source solution for your team to do analysis of real-time events streams, it can be used for web analytics, monitoring of events on infrastructure and similar applications.
The Pulsar Reporting UI is a reporting solution that allows your team to visualize your events and traffic in real-time. It allows both developers and final users to build customized dashboards and visualizations.
See the Github repository for setup.
See: Pulsar Reporting announcement in the ebay Tech Blog!
Pulsar Reporting UI is built on AngularJS. Users can create visualizations using a point-and-click interfaces and developers to create visualizations by using lower-level Pulsar components.
Full documentation for development is at Pulsar Reporting JS Docs.
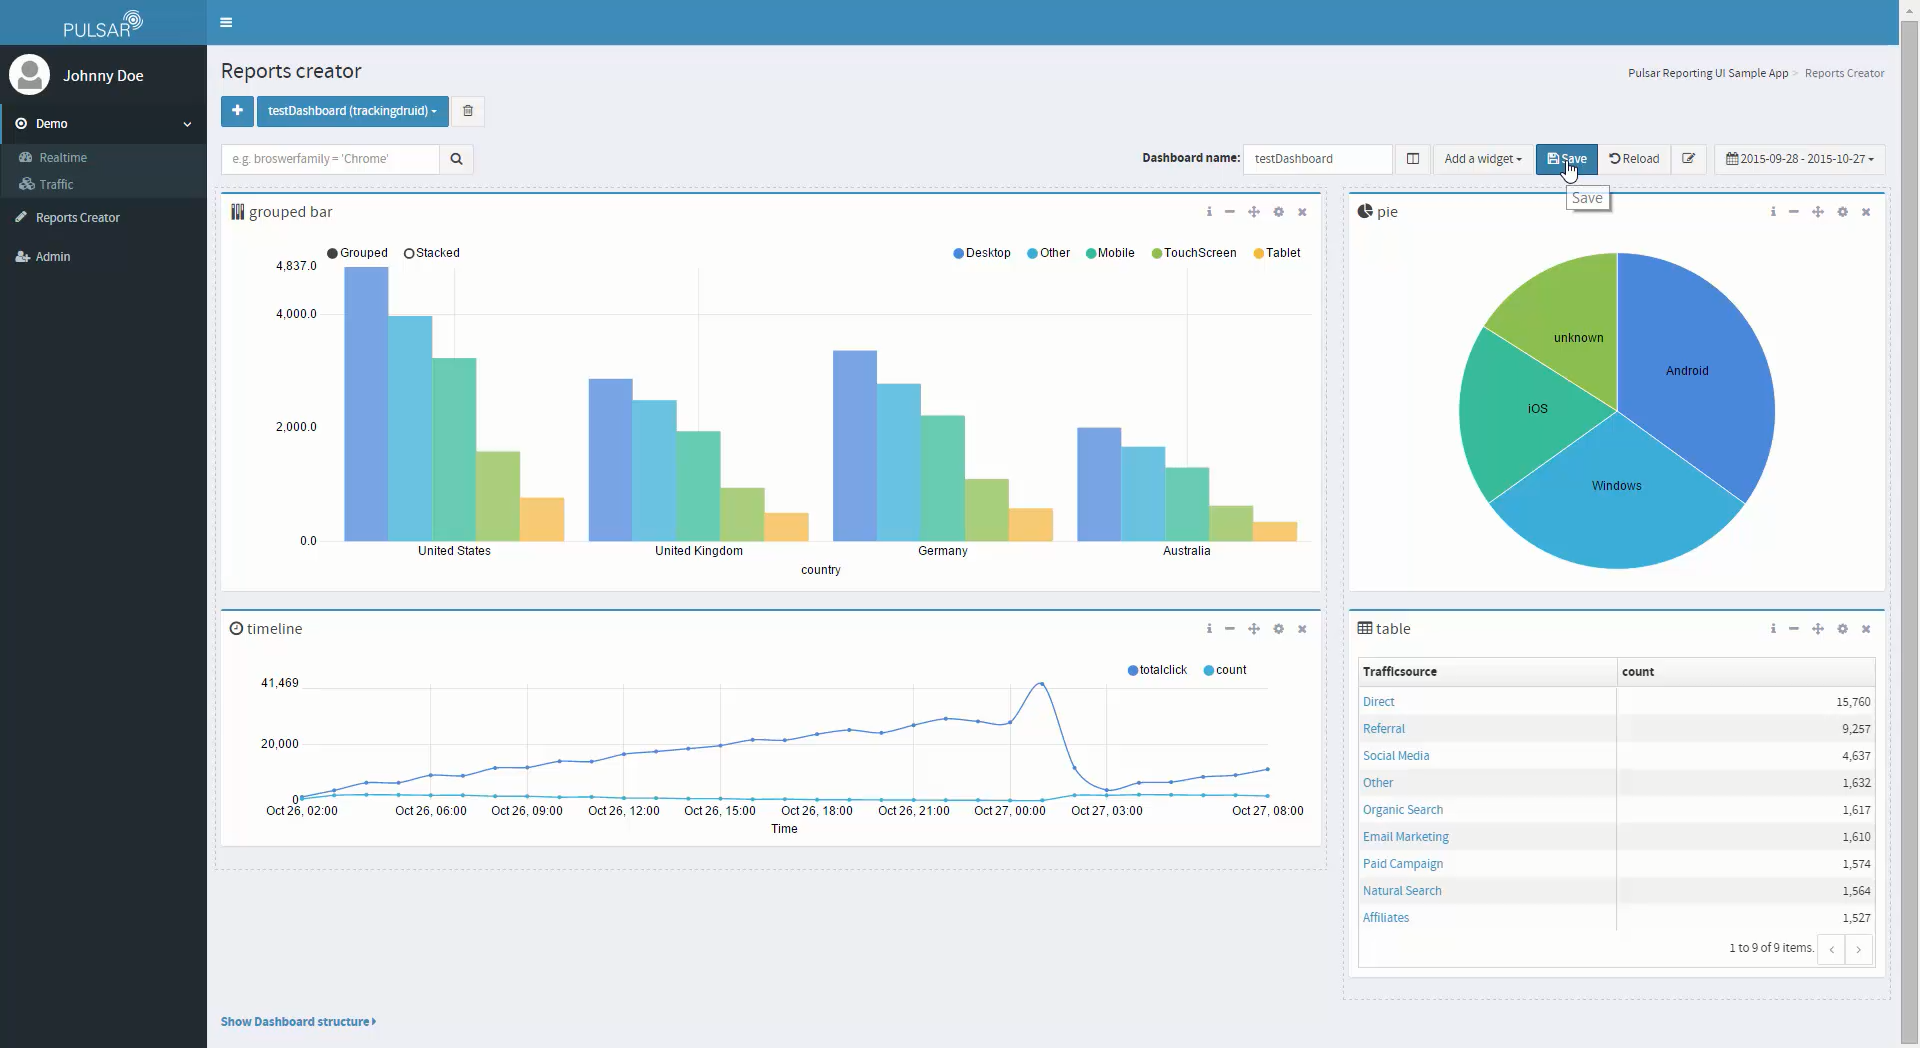
Features & Screenshots
- Time bound and Real-time visualizations
- Dimension vs. Metric visualizations
- Display of widgets which display fetched data
Out-of-the-box dashboard
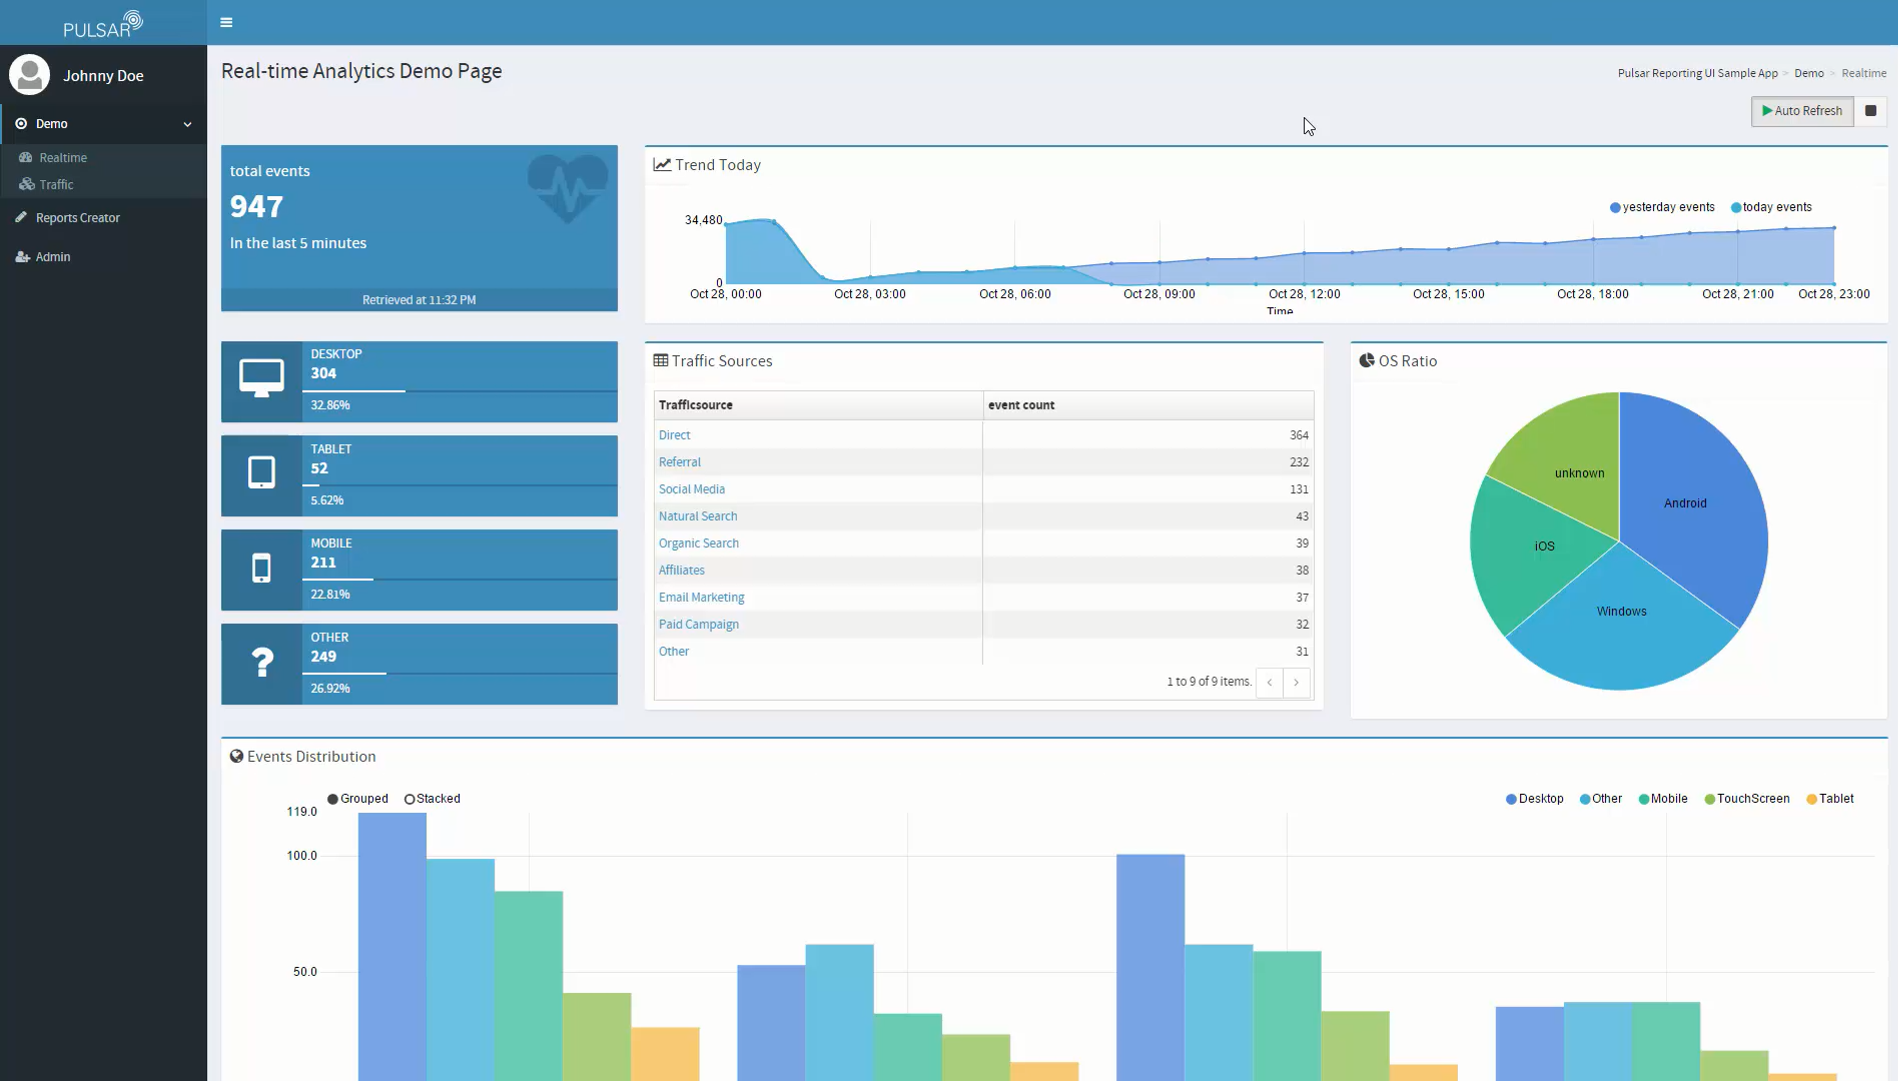
Real-time data flow (Trend Today)
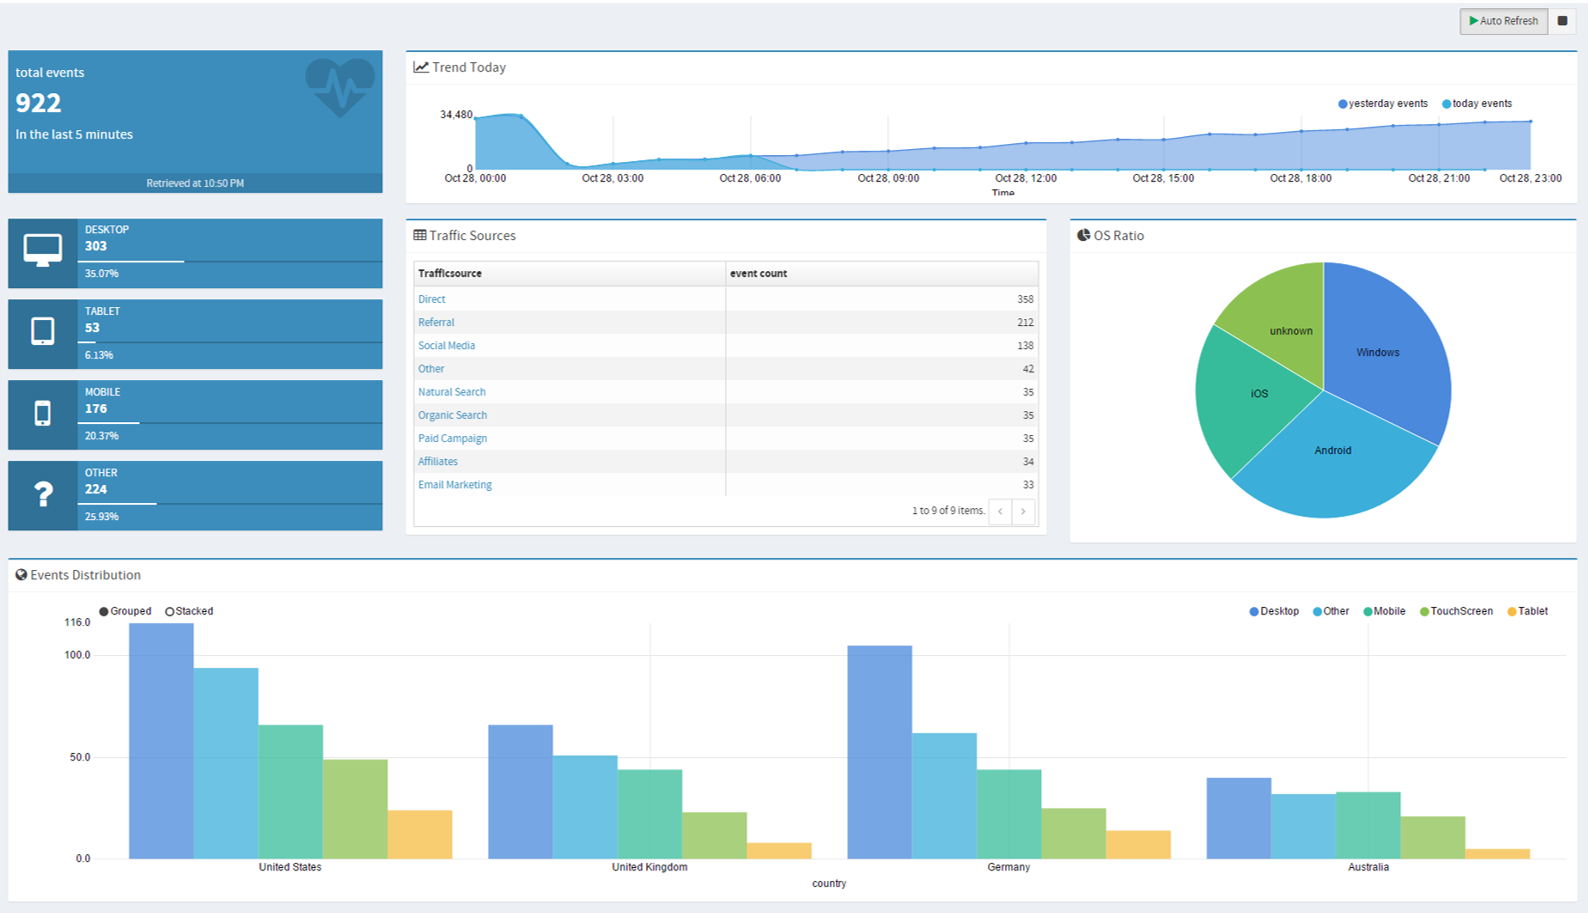
Number of visitors example (segregated by source)
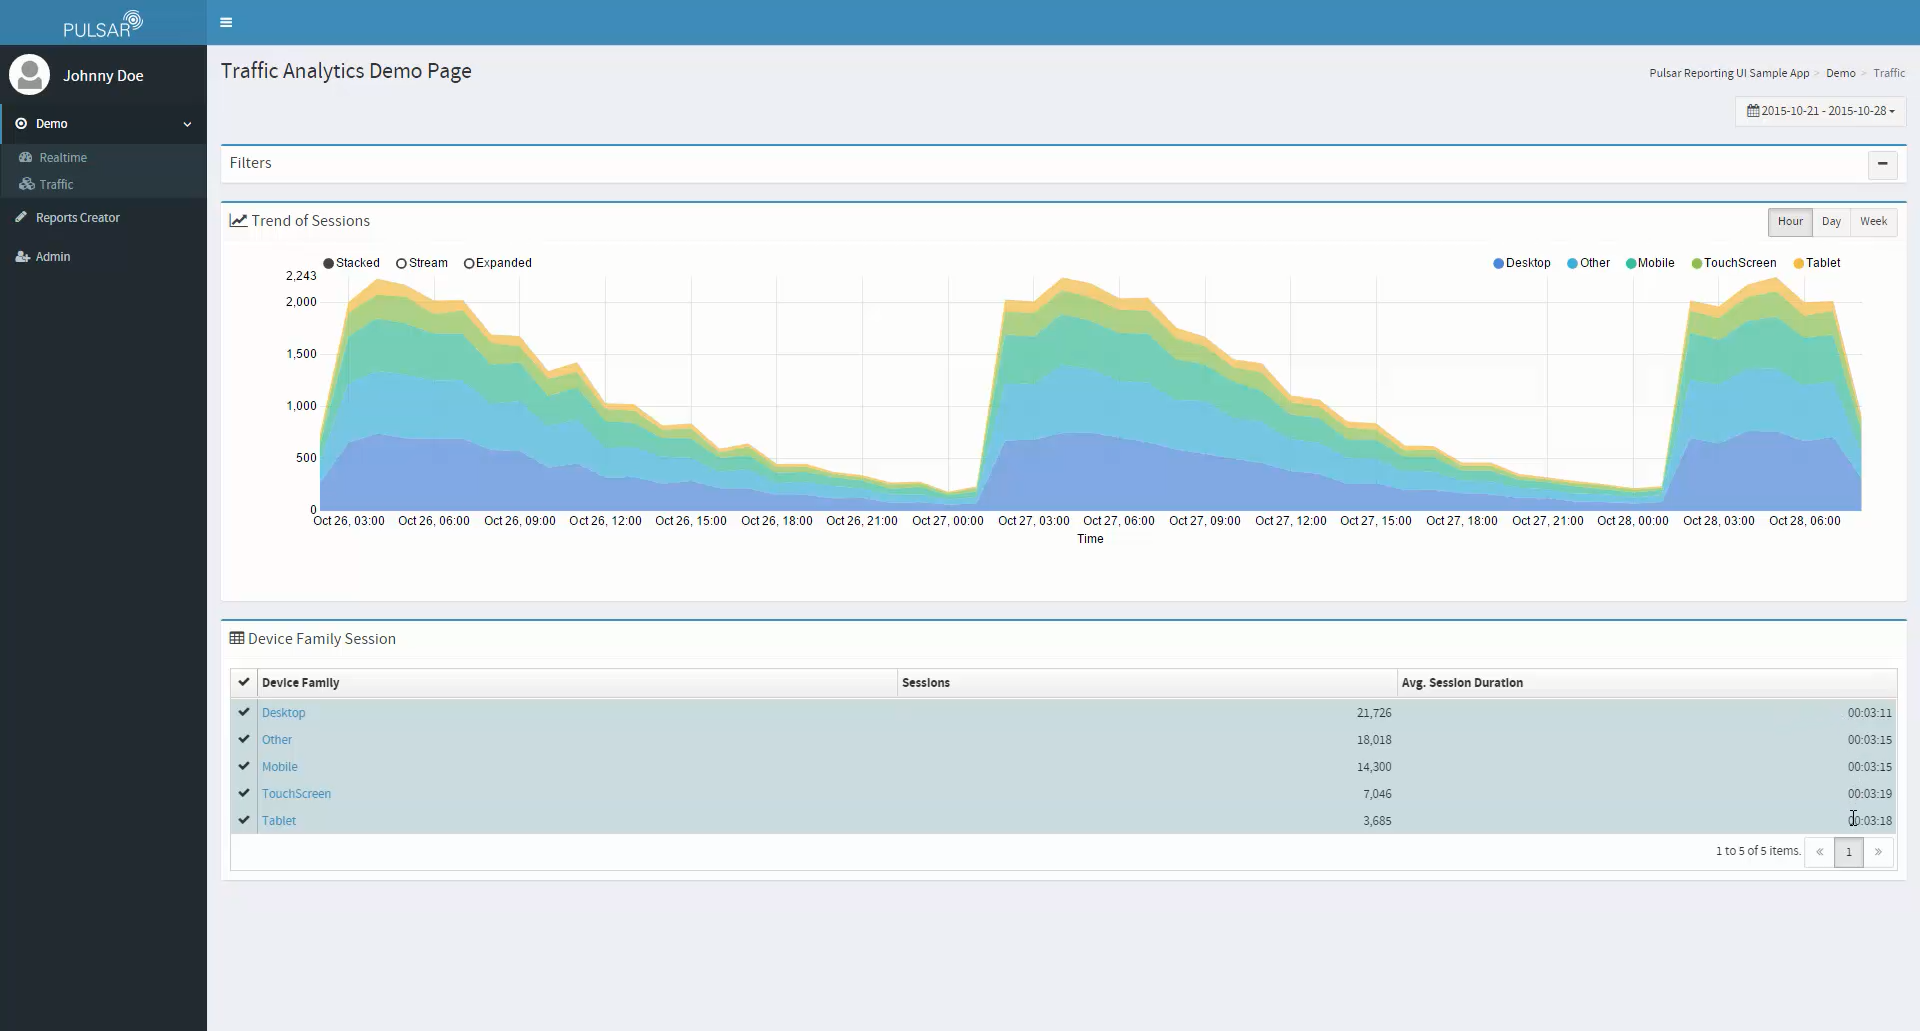
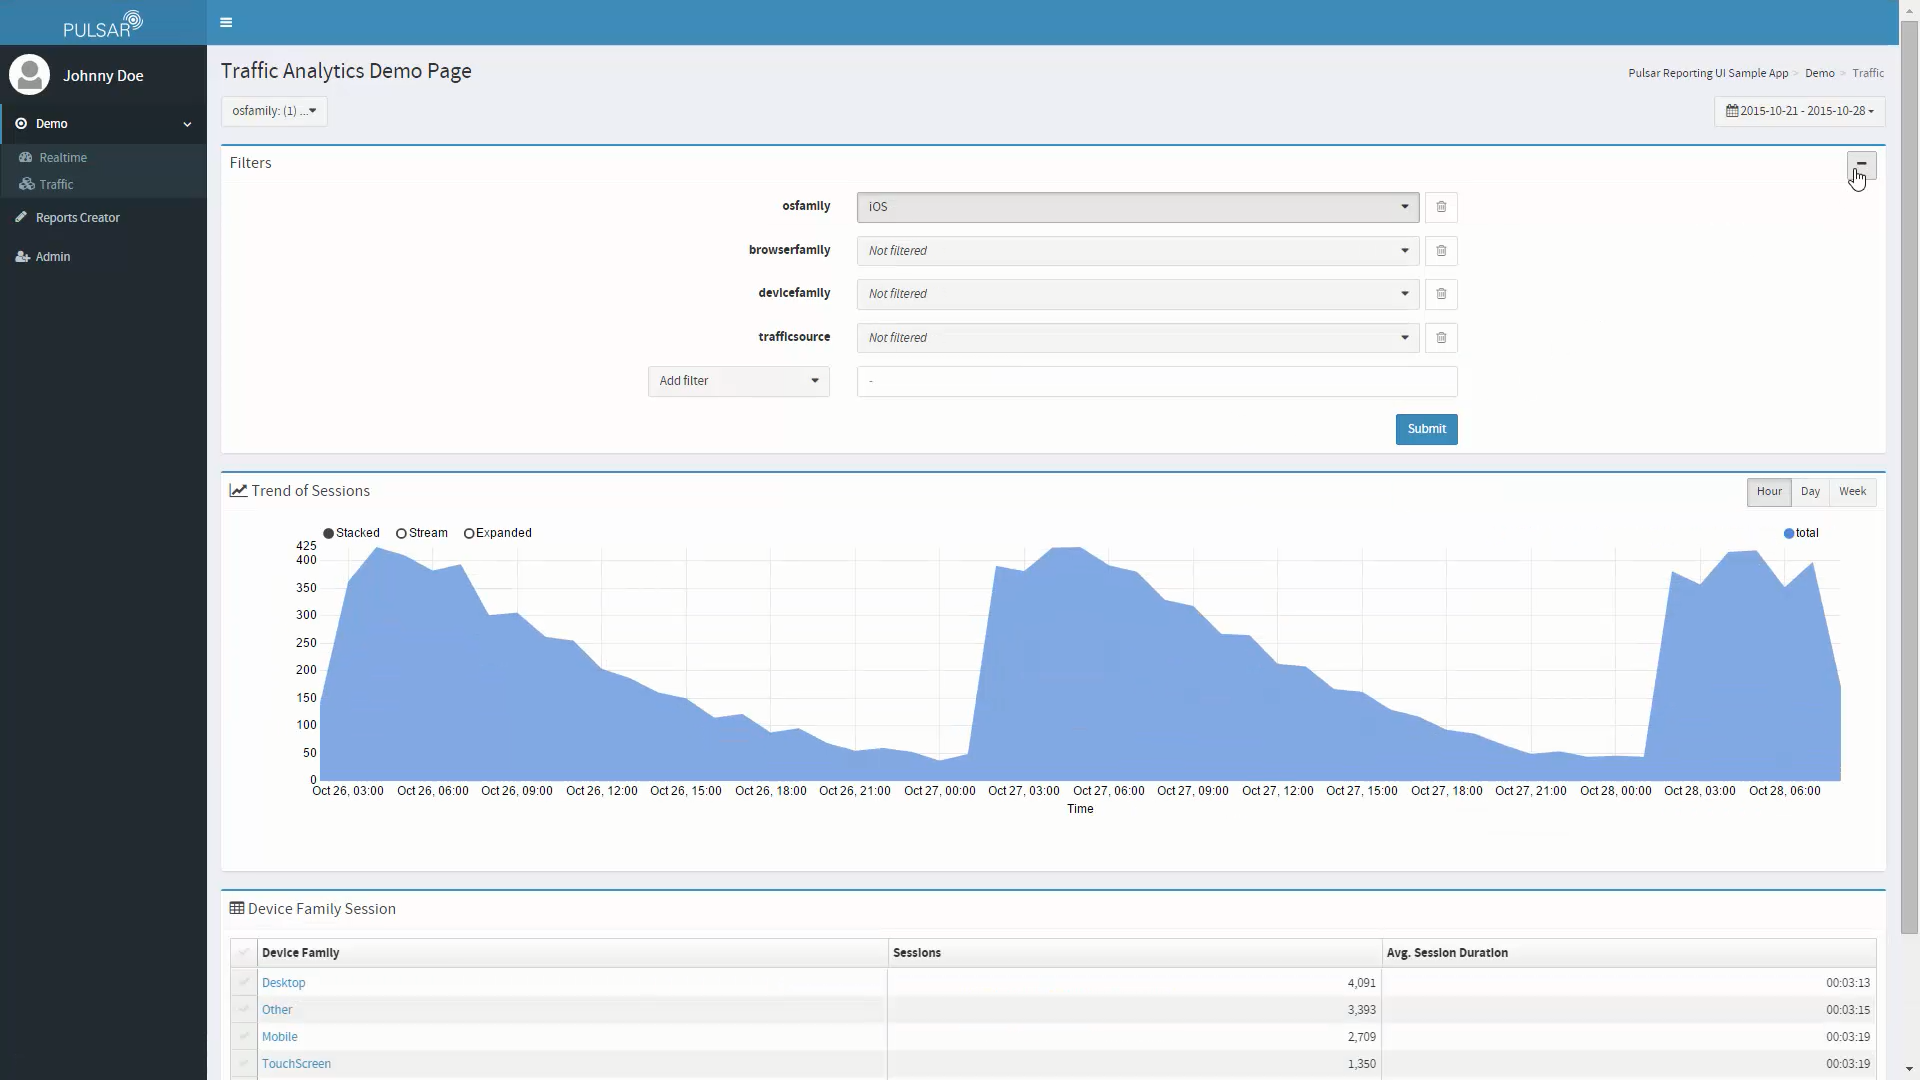
Sessions filtering by source
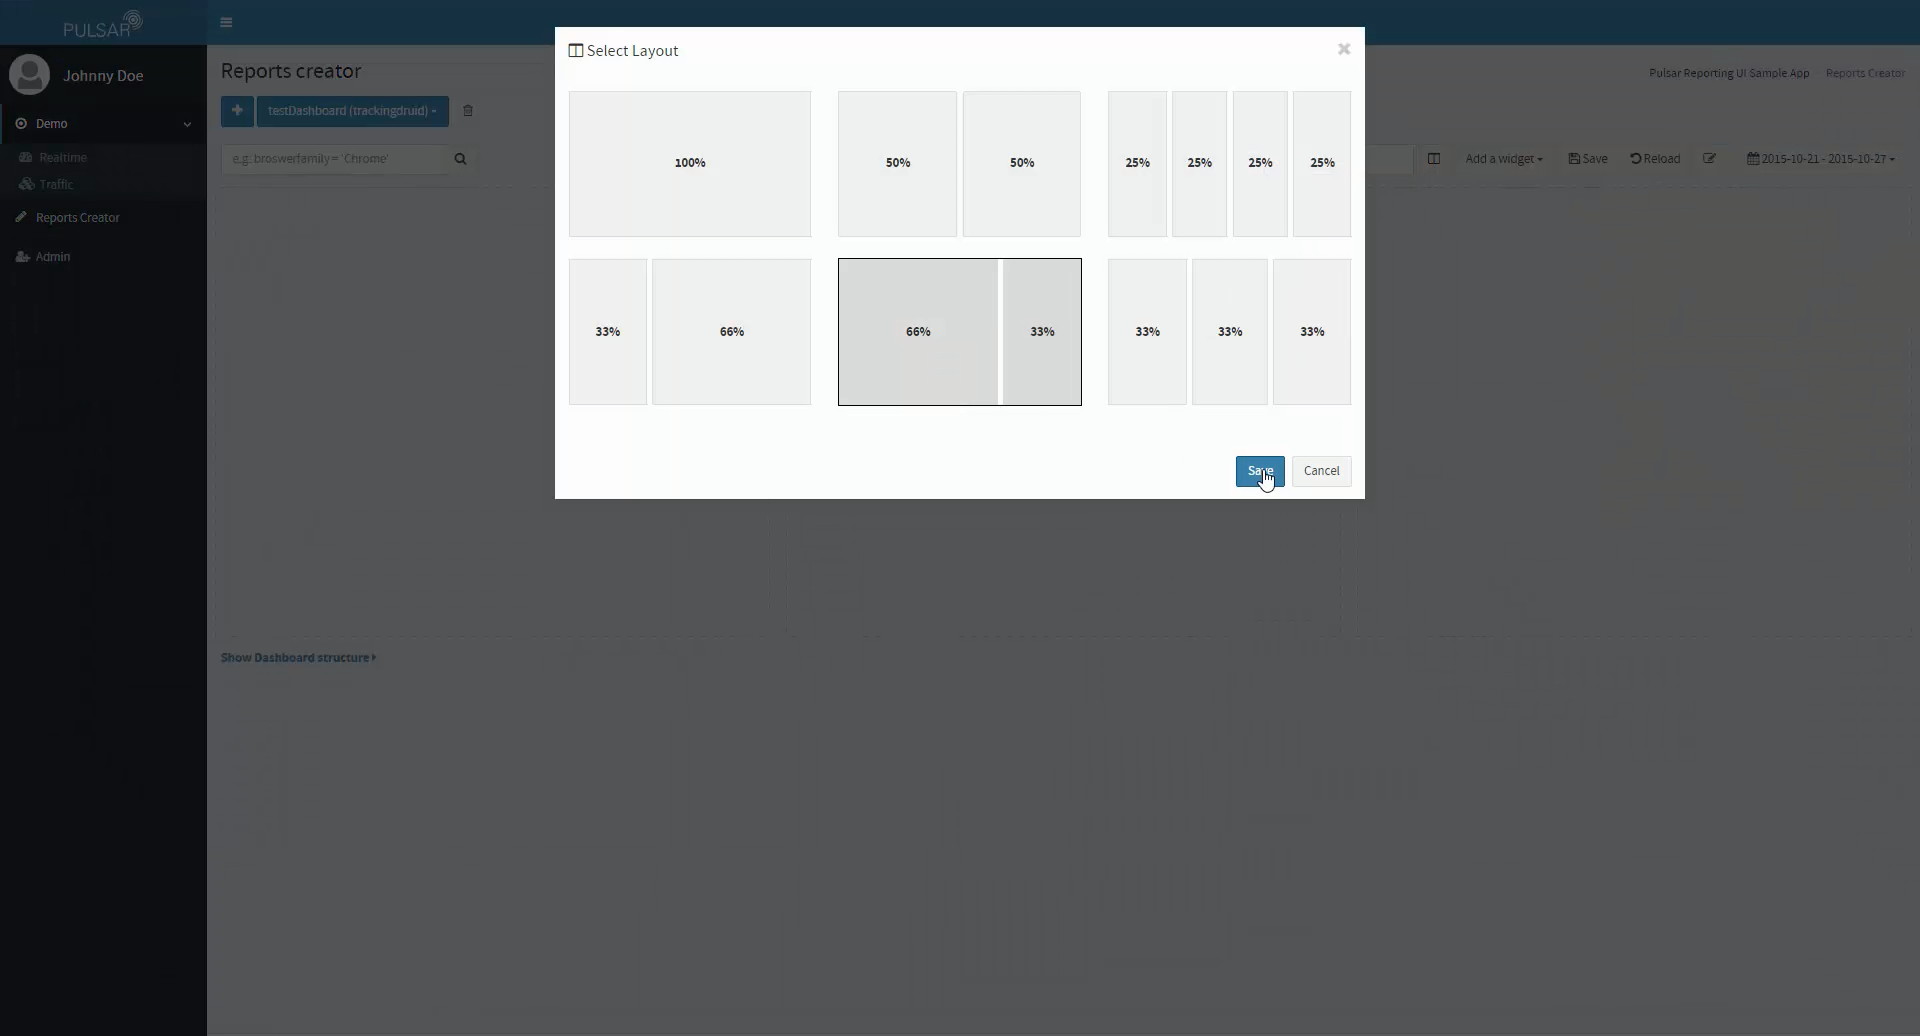
Custom Dashboards creation and updating
- Creation of dashboards by grouping widgets programatically
- Creation of dashboards from the UI for non-experts users
- Administrative capabilities to manage users and access
Learn more
- My fork of the Pulsar Front-end Repository
- Pulsar Reporting UI depends on the Pulsar Reporting API.
- See the original whitepaper Pulsar – Real-time Analytics at Scale (PDF download)
- Technologies used: AngularJS, NVD3, Bootstrap, Admin LTE.